This project investigates deforestation trends in Brazil from 2000 to 2023, focusing on spatial patterns and potential correlations with national political leadership. Using shapefiles from geobr, we built a Shiny App with geographic data at the national, state, and municipal levels to visualize tree cover change. We also created a custom dataset of Brazilian presidents with political leanings, enabling users to explore deforestation data in political context.
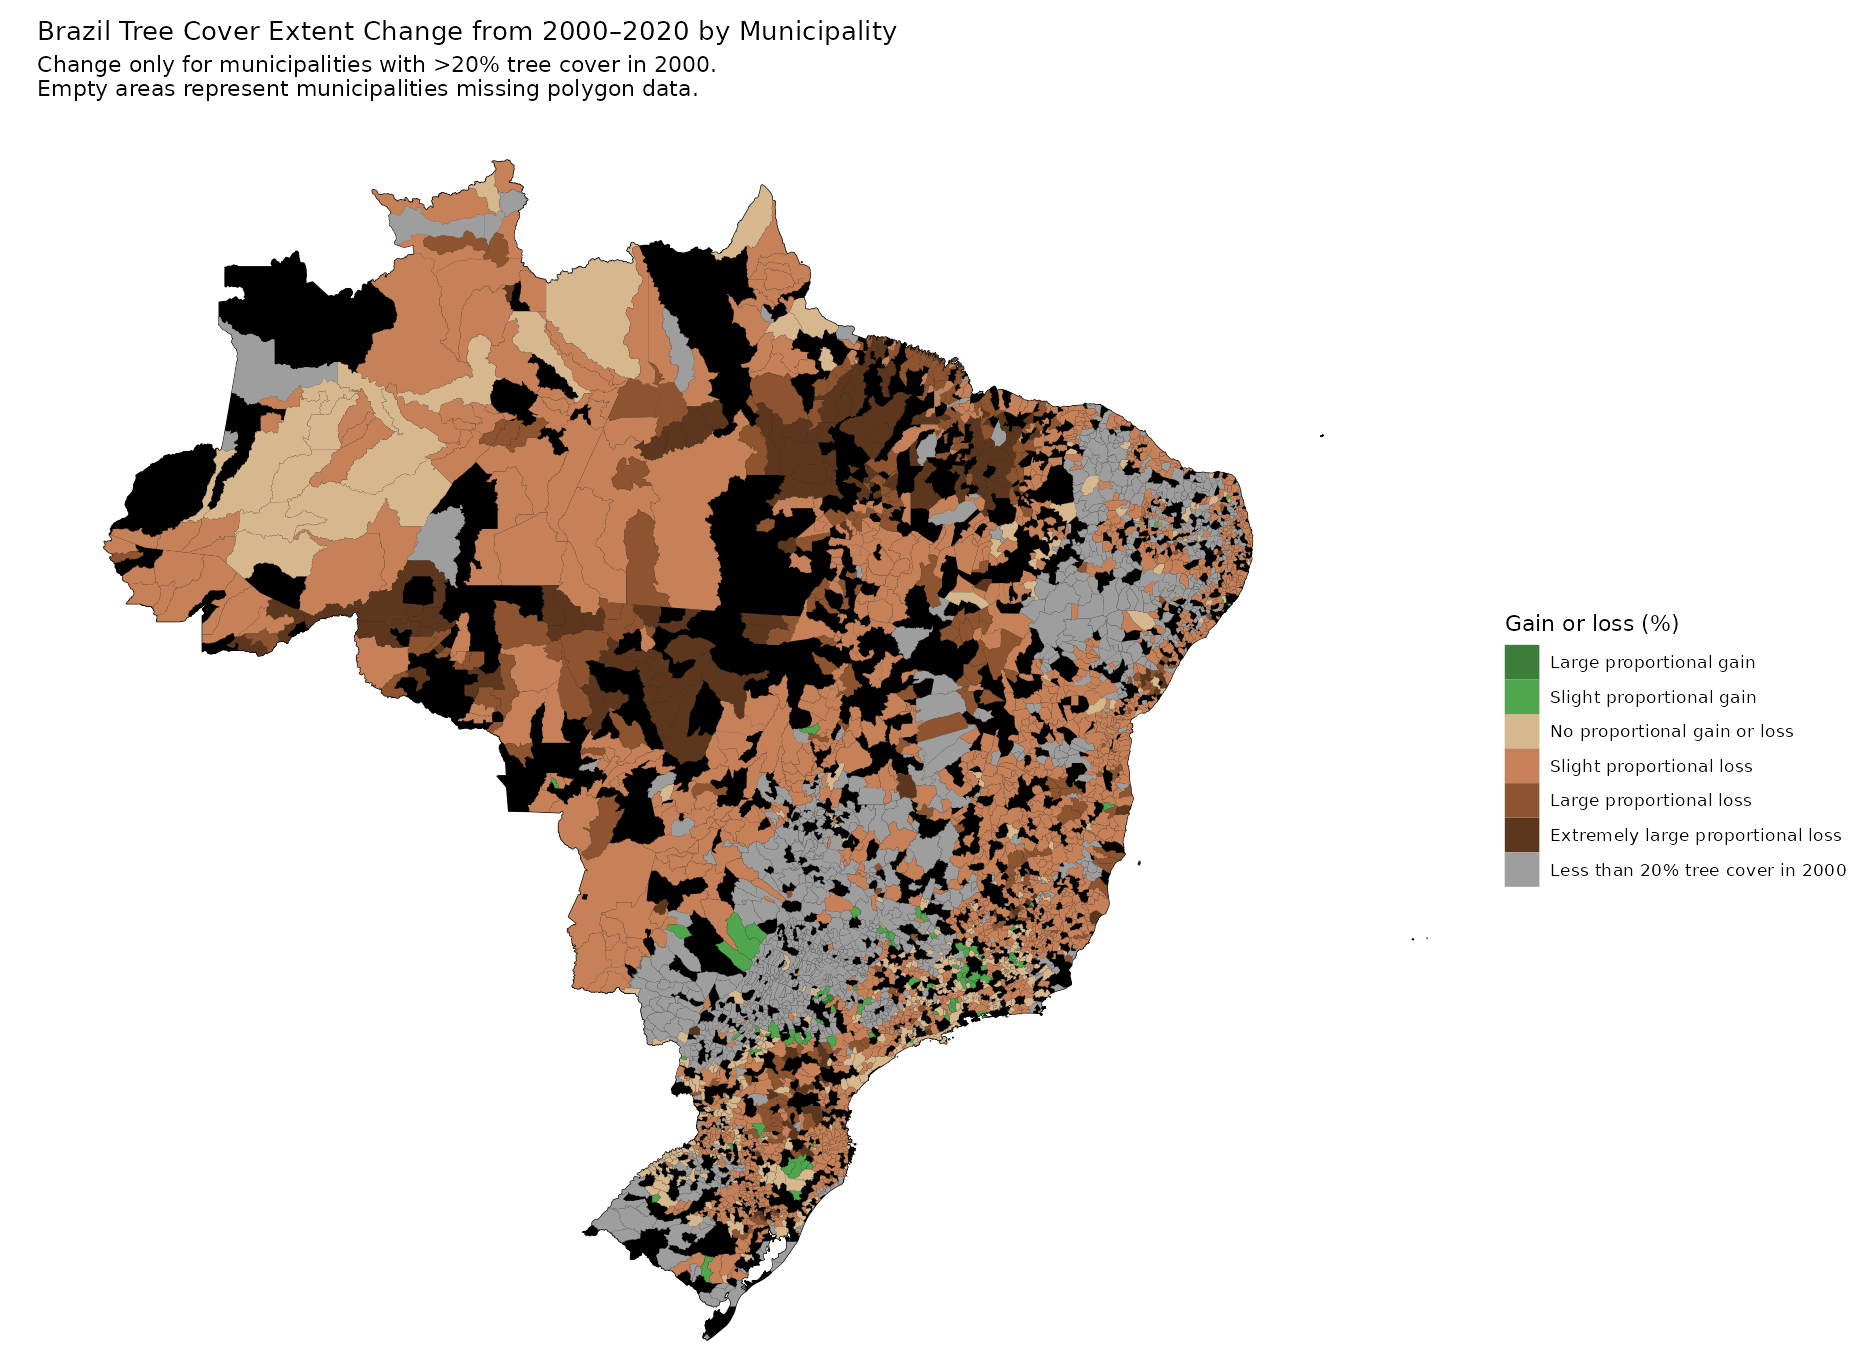
The app includes multiple interactive components: a tree cover map with selectable years (2000, 2010, 2020); a categorized map of municipal-level tree cover change; a rolling-average line plot of state-level tree loss over time; and a national-level annual loss chart with colored indicators for each administration. Clicking on the national plot reveals information about the president in office that year. The tool offers a data-driven lens into how environmental outcomes may relate to shifts in governance.